
Mapmaker Matrices
Cartographic connections in the Collection by Melissa Irving
The Sunderland Collection houses maps, atlases, and books of knowledge spanning six centuries, created by cartographers from around the world. Mapmakers, astronomers, and geographers cultivated intricate networks that facilitated an international exchange of knowledge and ideas.
Our interactive map matrices aim to uncover these connections, highlighting key relationships such as apprenticeships, collaborations, patronage, and the purchasing of printing plates. By visualising these links between cartographers, publishers, scholars and scientists, the collection is brought to life, inviting us to view it not just as a series of standalone books, but as a dynamic compendium of cosmographical knowledge, continually reshaped and refined over the centuries through intellectual exchange.
Zoom in to explore relationships, uncover collaborations, and see how bodies of work intertwined across time and fields.
Click on the black 'expand' icon in the lower right of each matrix to open each diagram. Between each of the portraits of the mapmakers, there are small circular icons, which when you click them open text panels to describe the nature of the connection. More accessibility information can be found at the end of this page.
Shared Knowledge and Apprenticeship Connections
This matrix visualizes how knowledge was passed down through generations of cartographers, both through the transfer of major cosmographical ideas and more subtle methods, such as one-on-one apprenticeships.
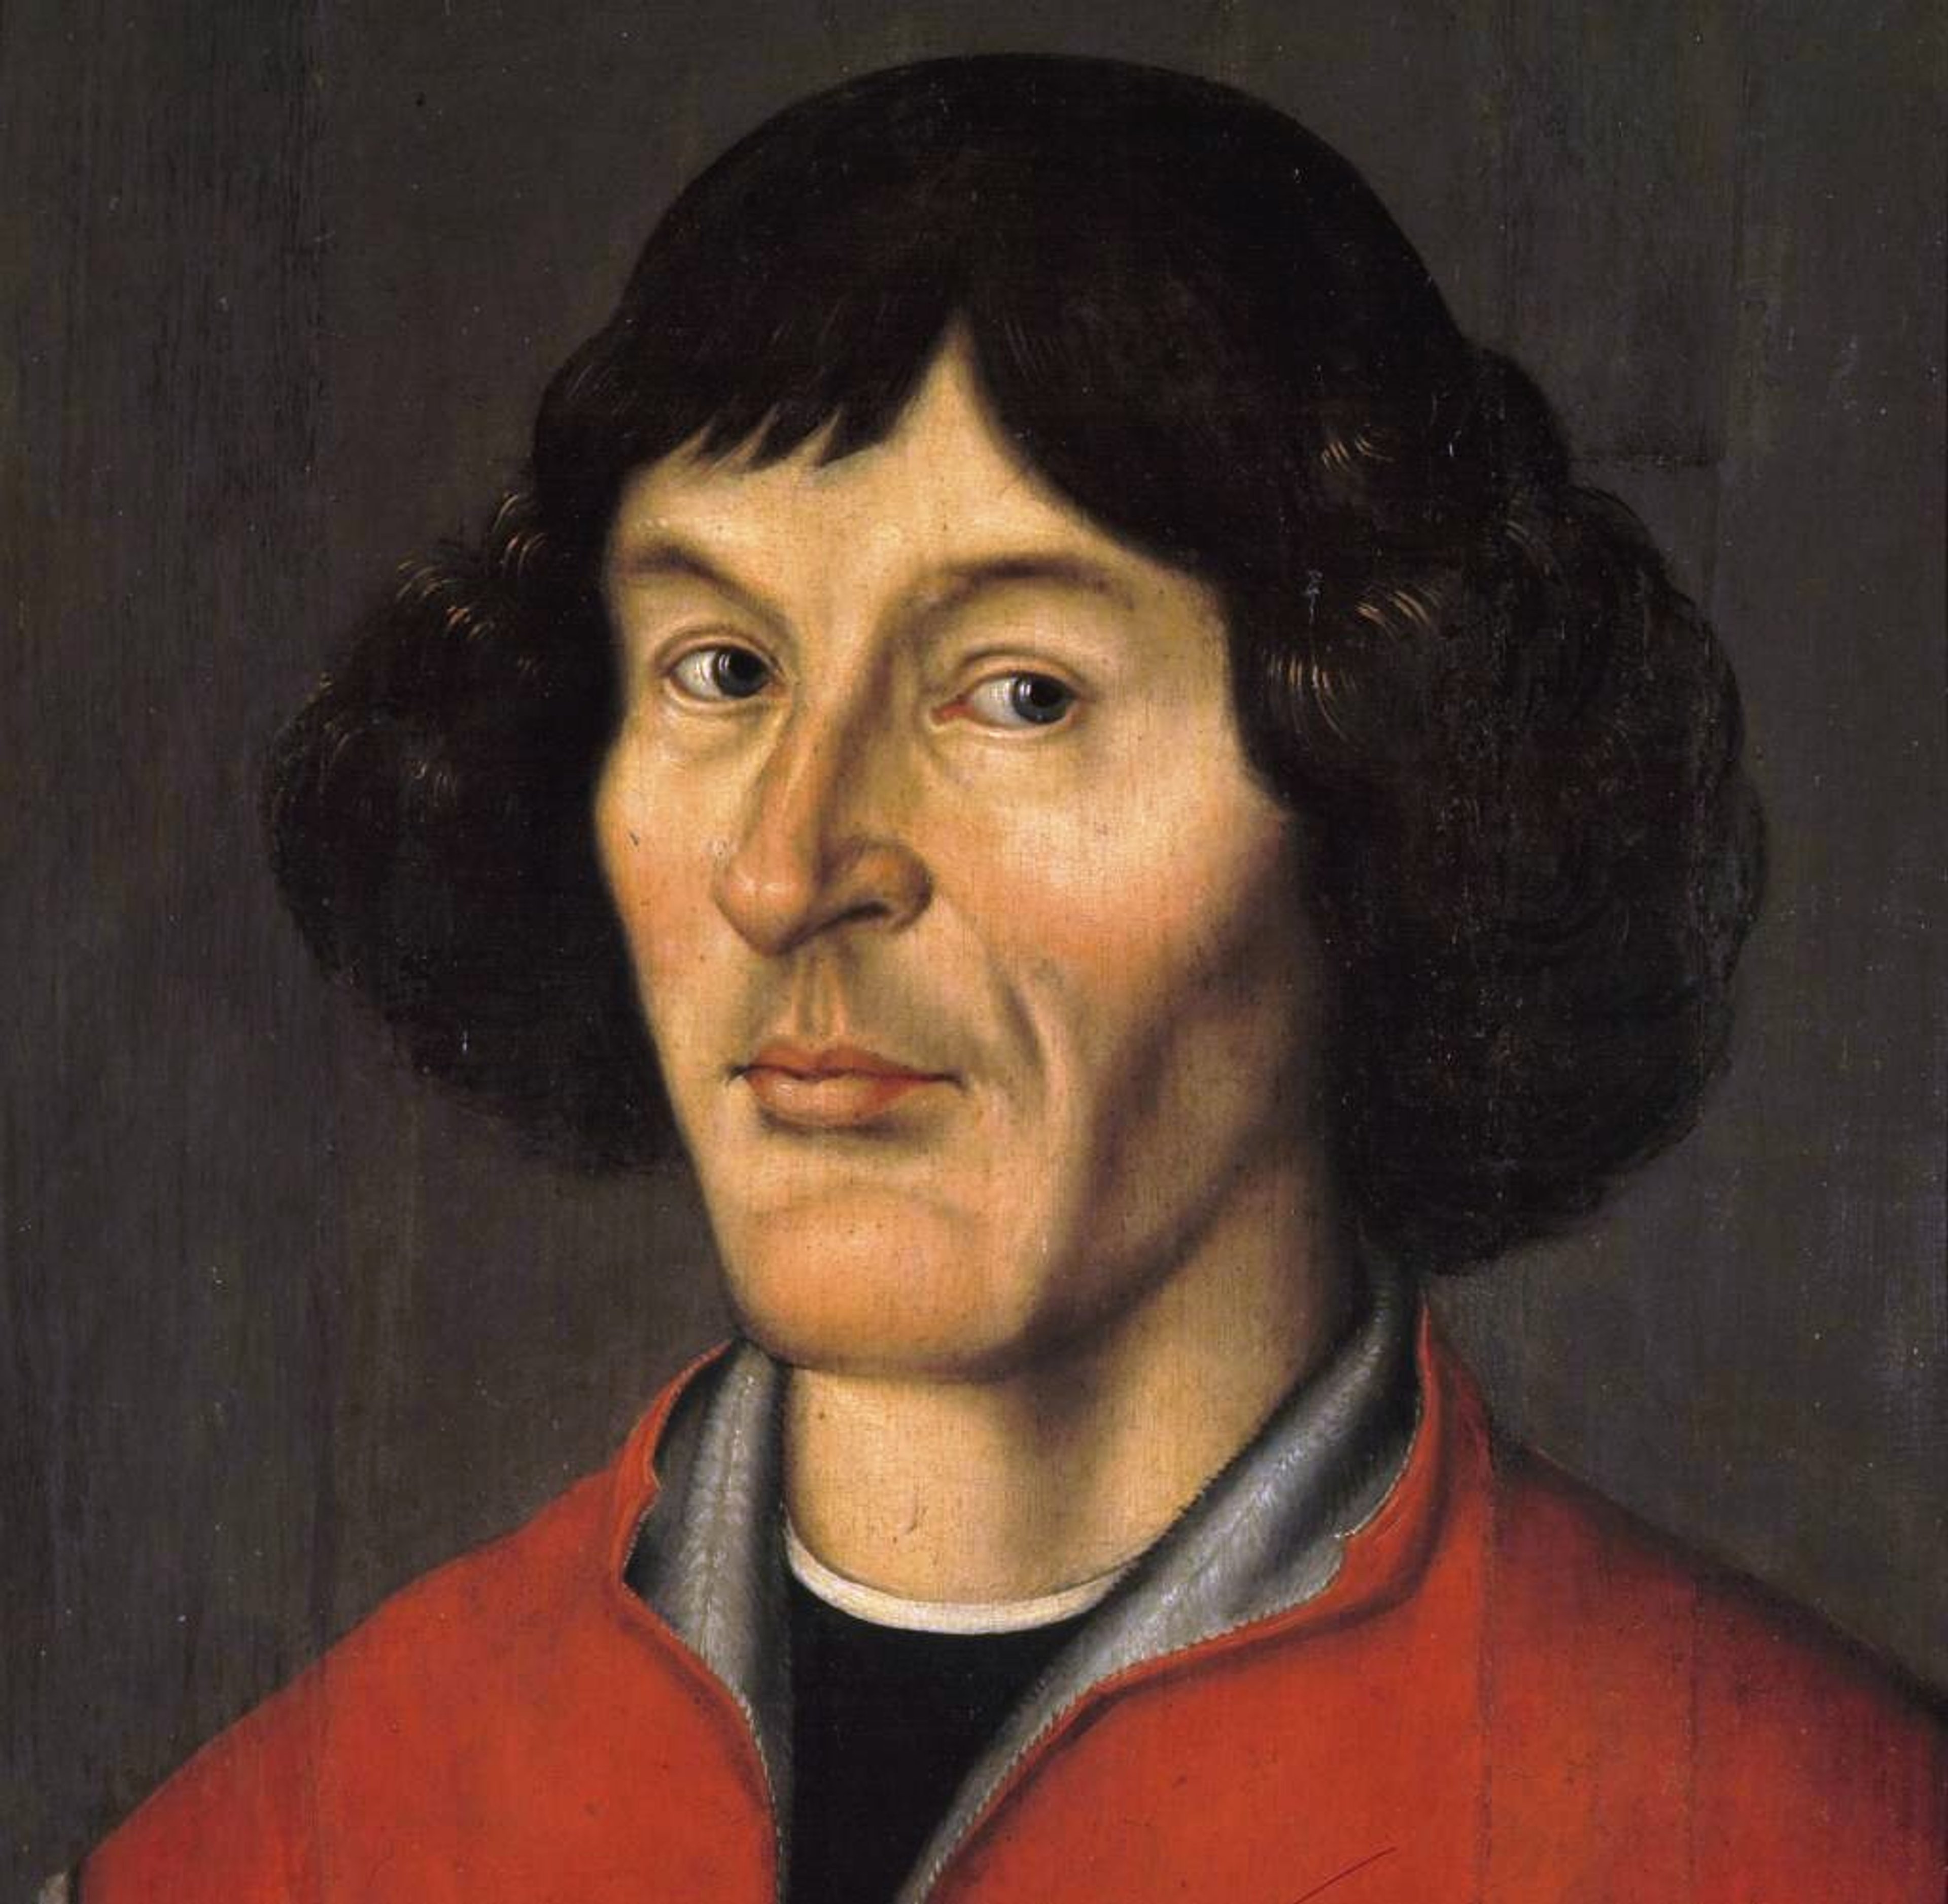
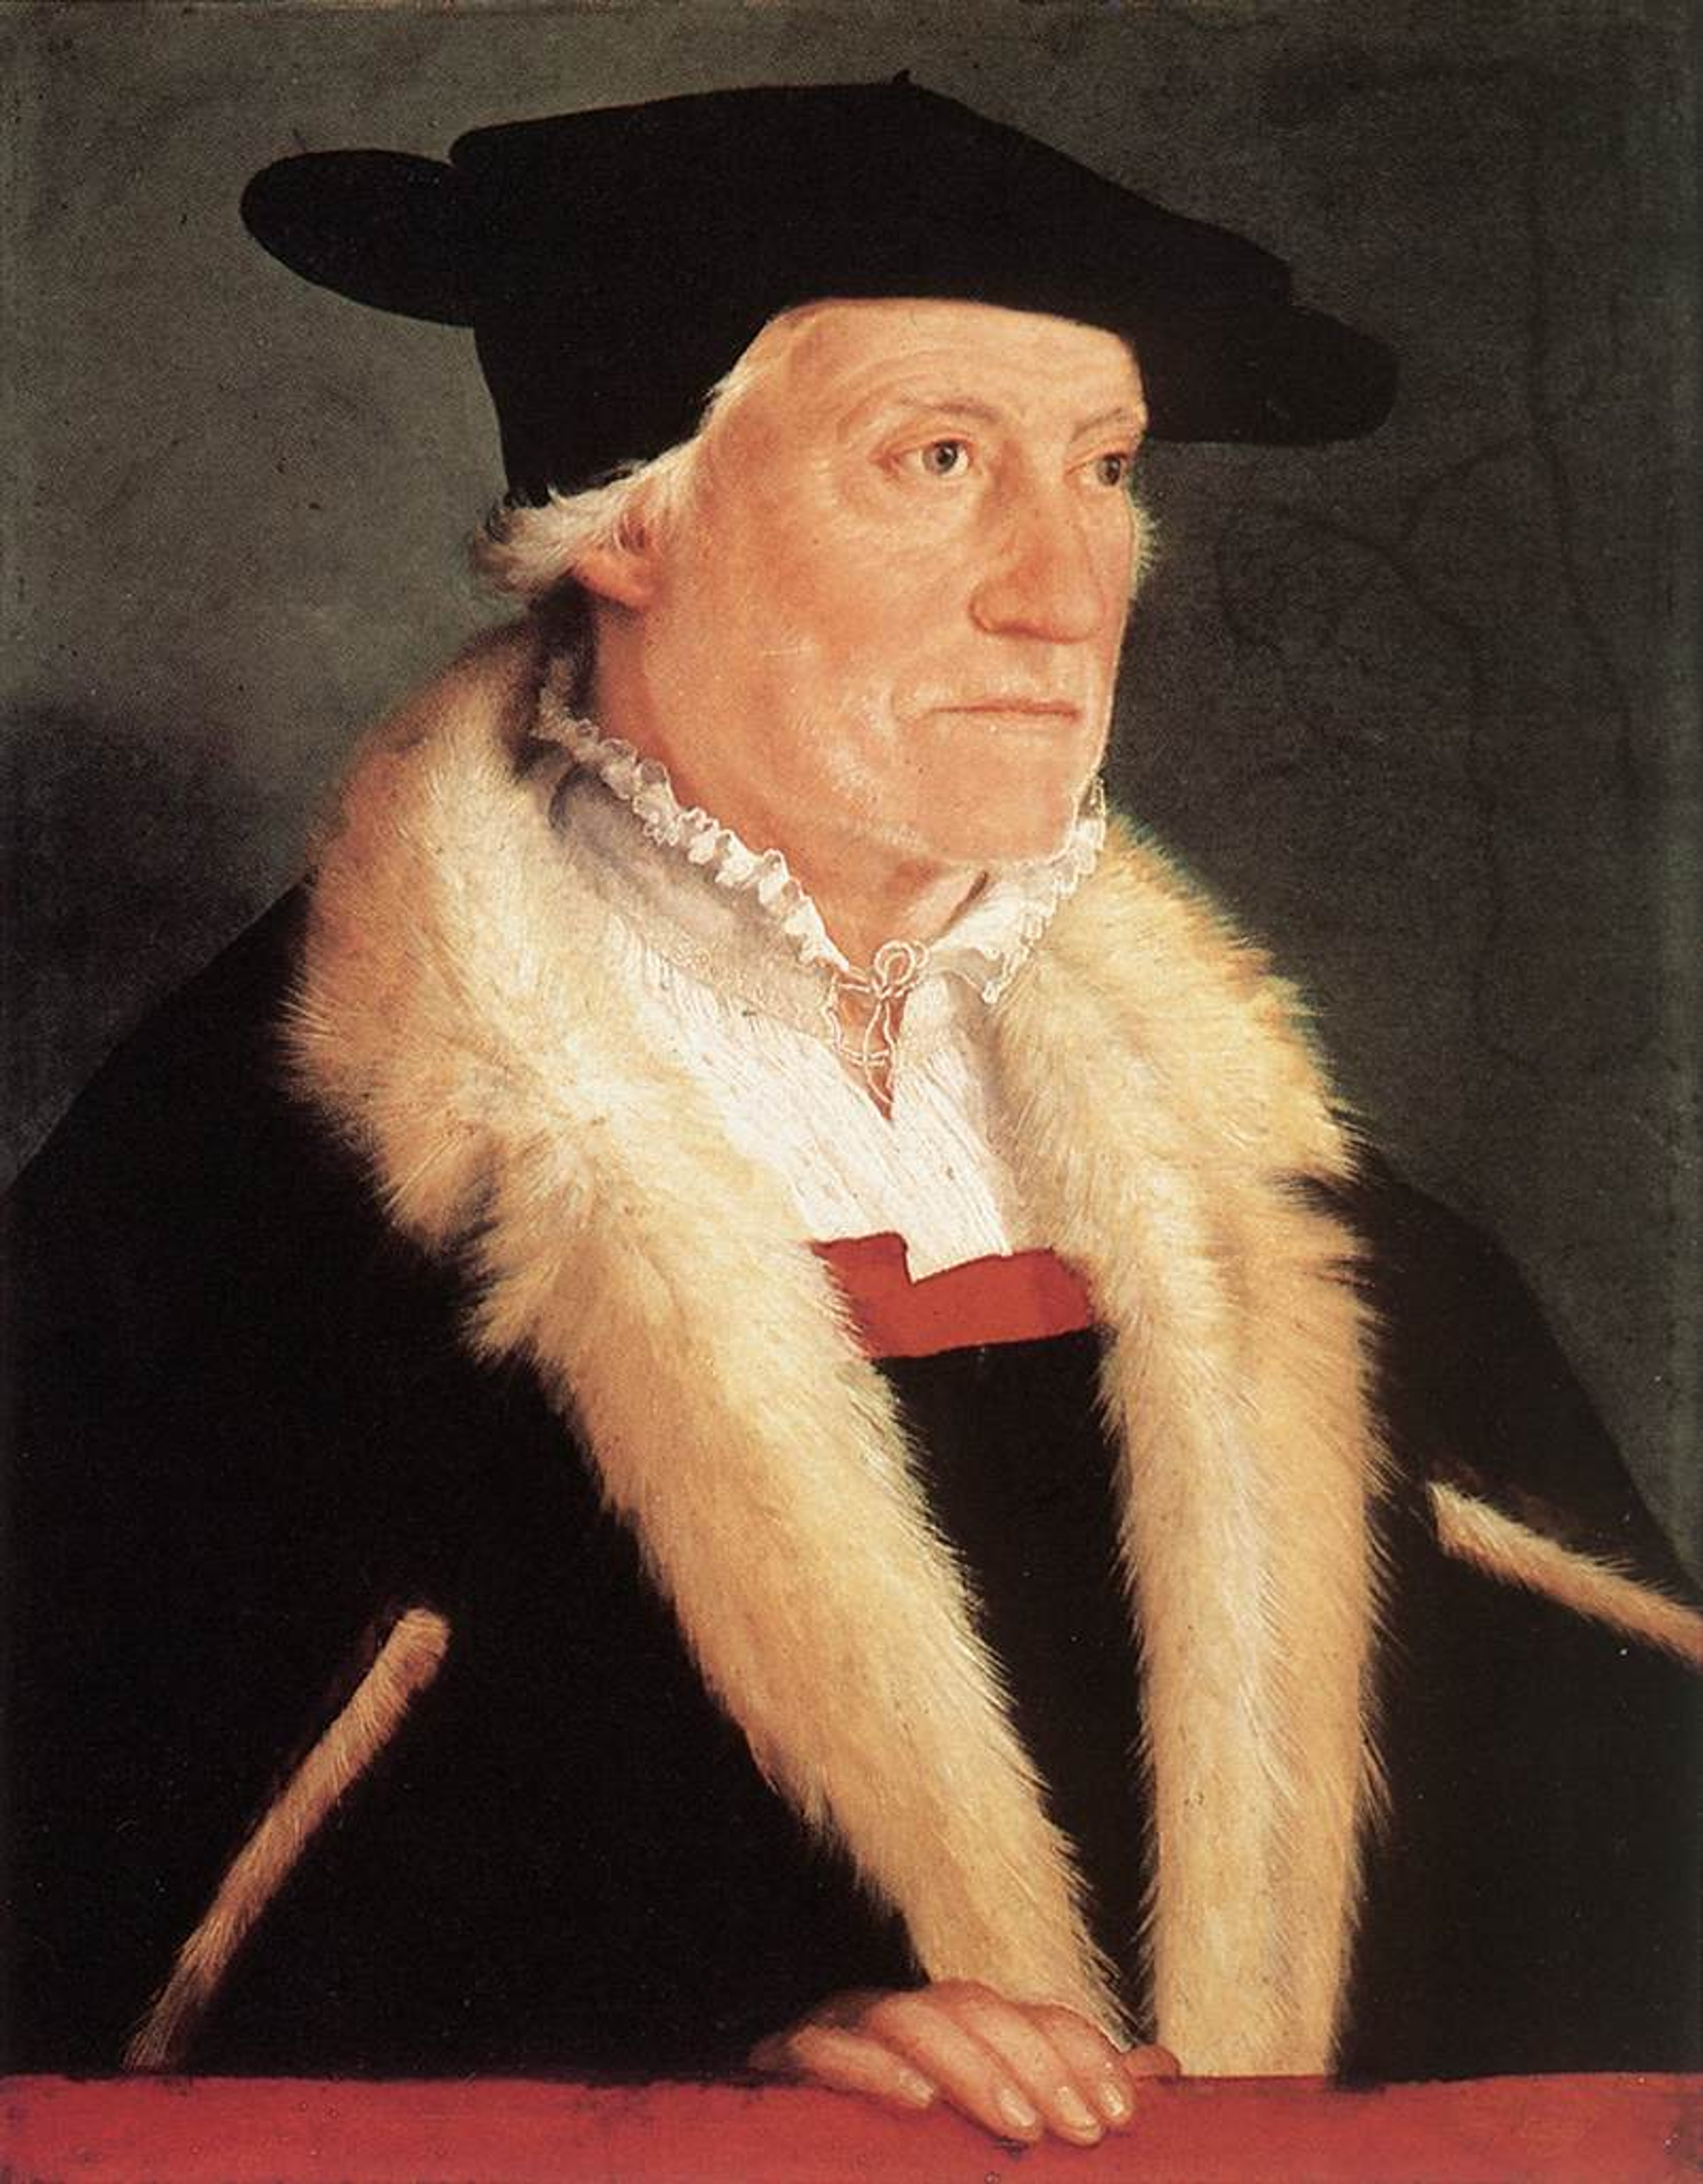
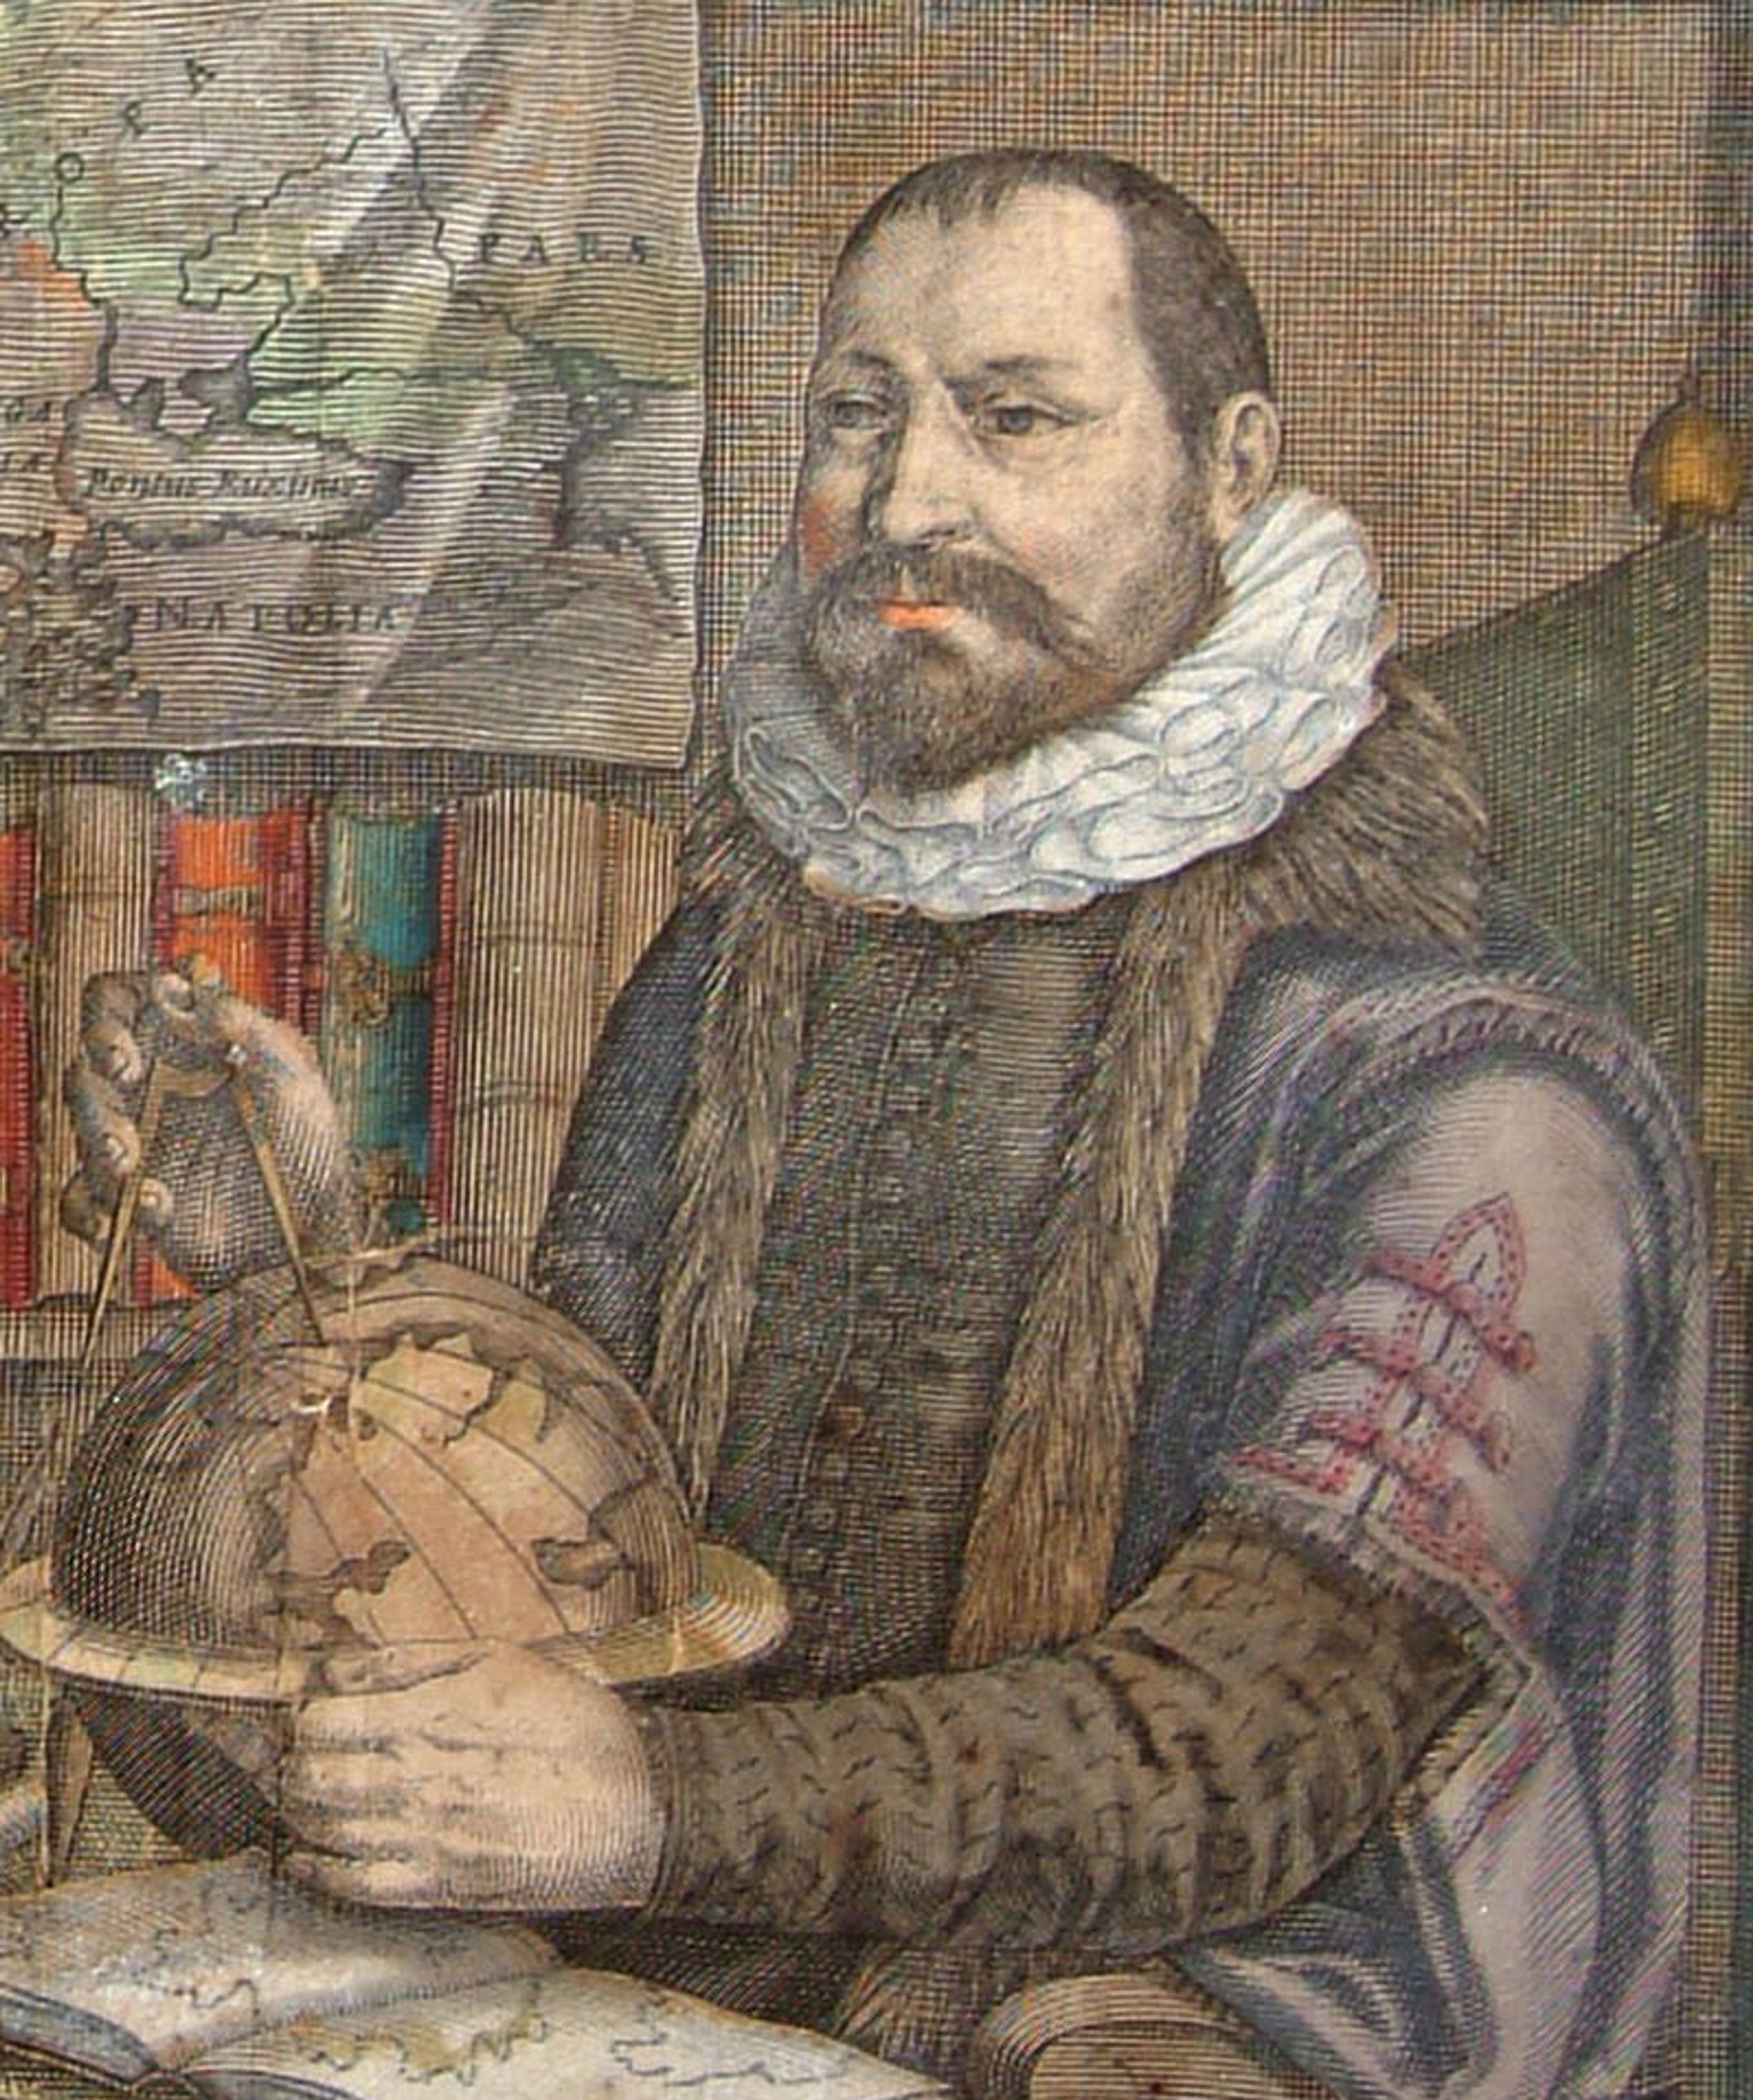
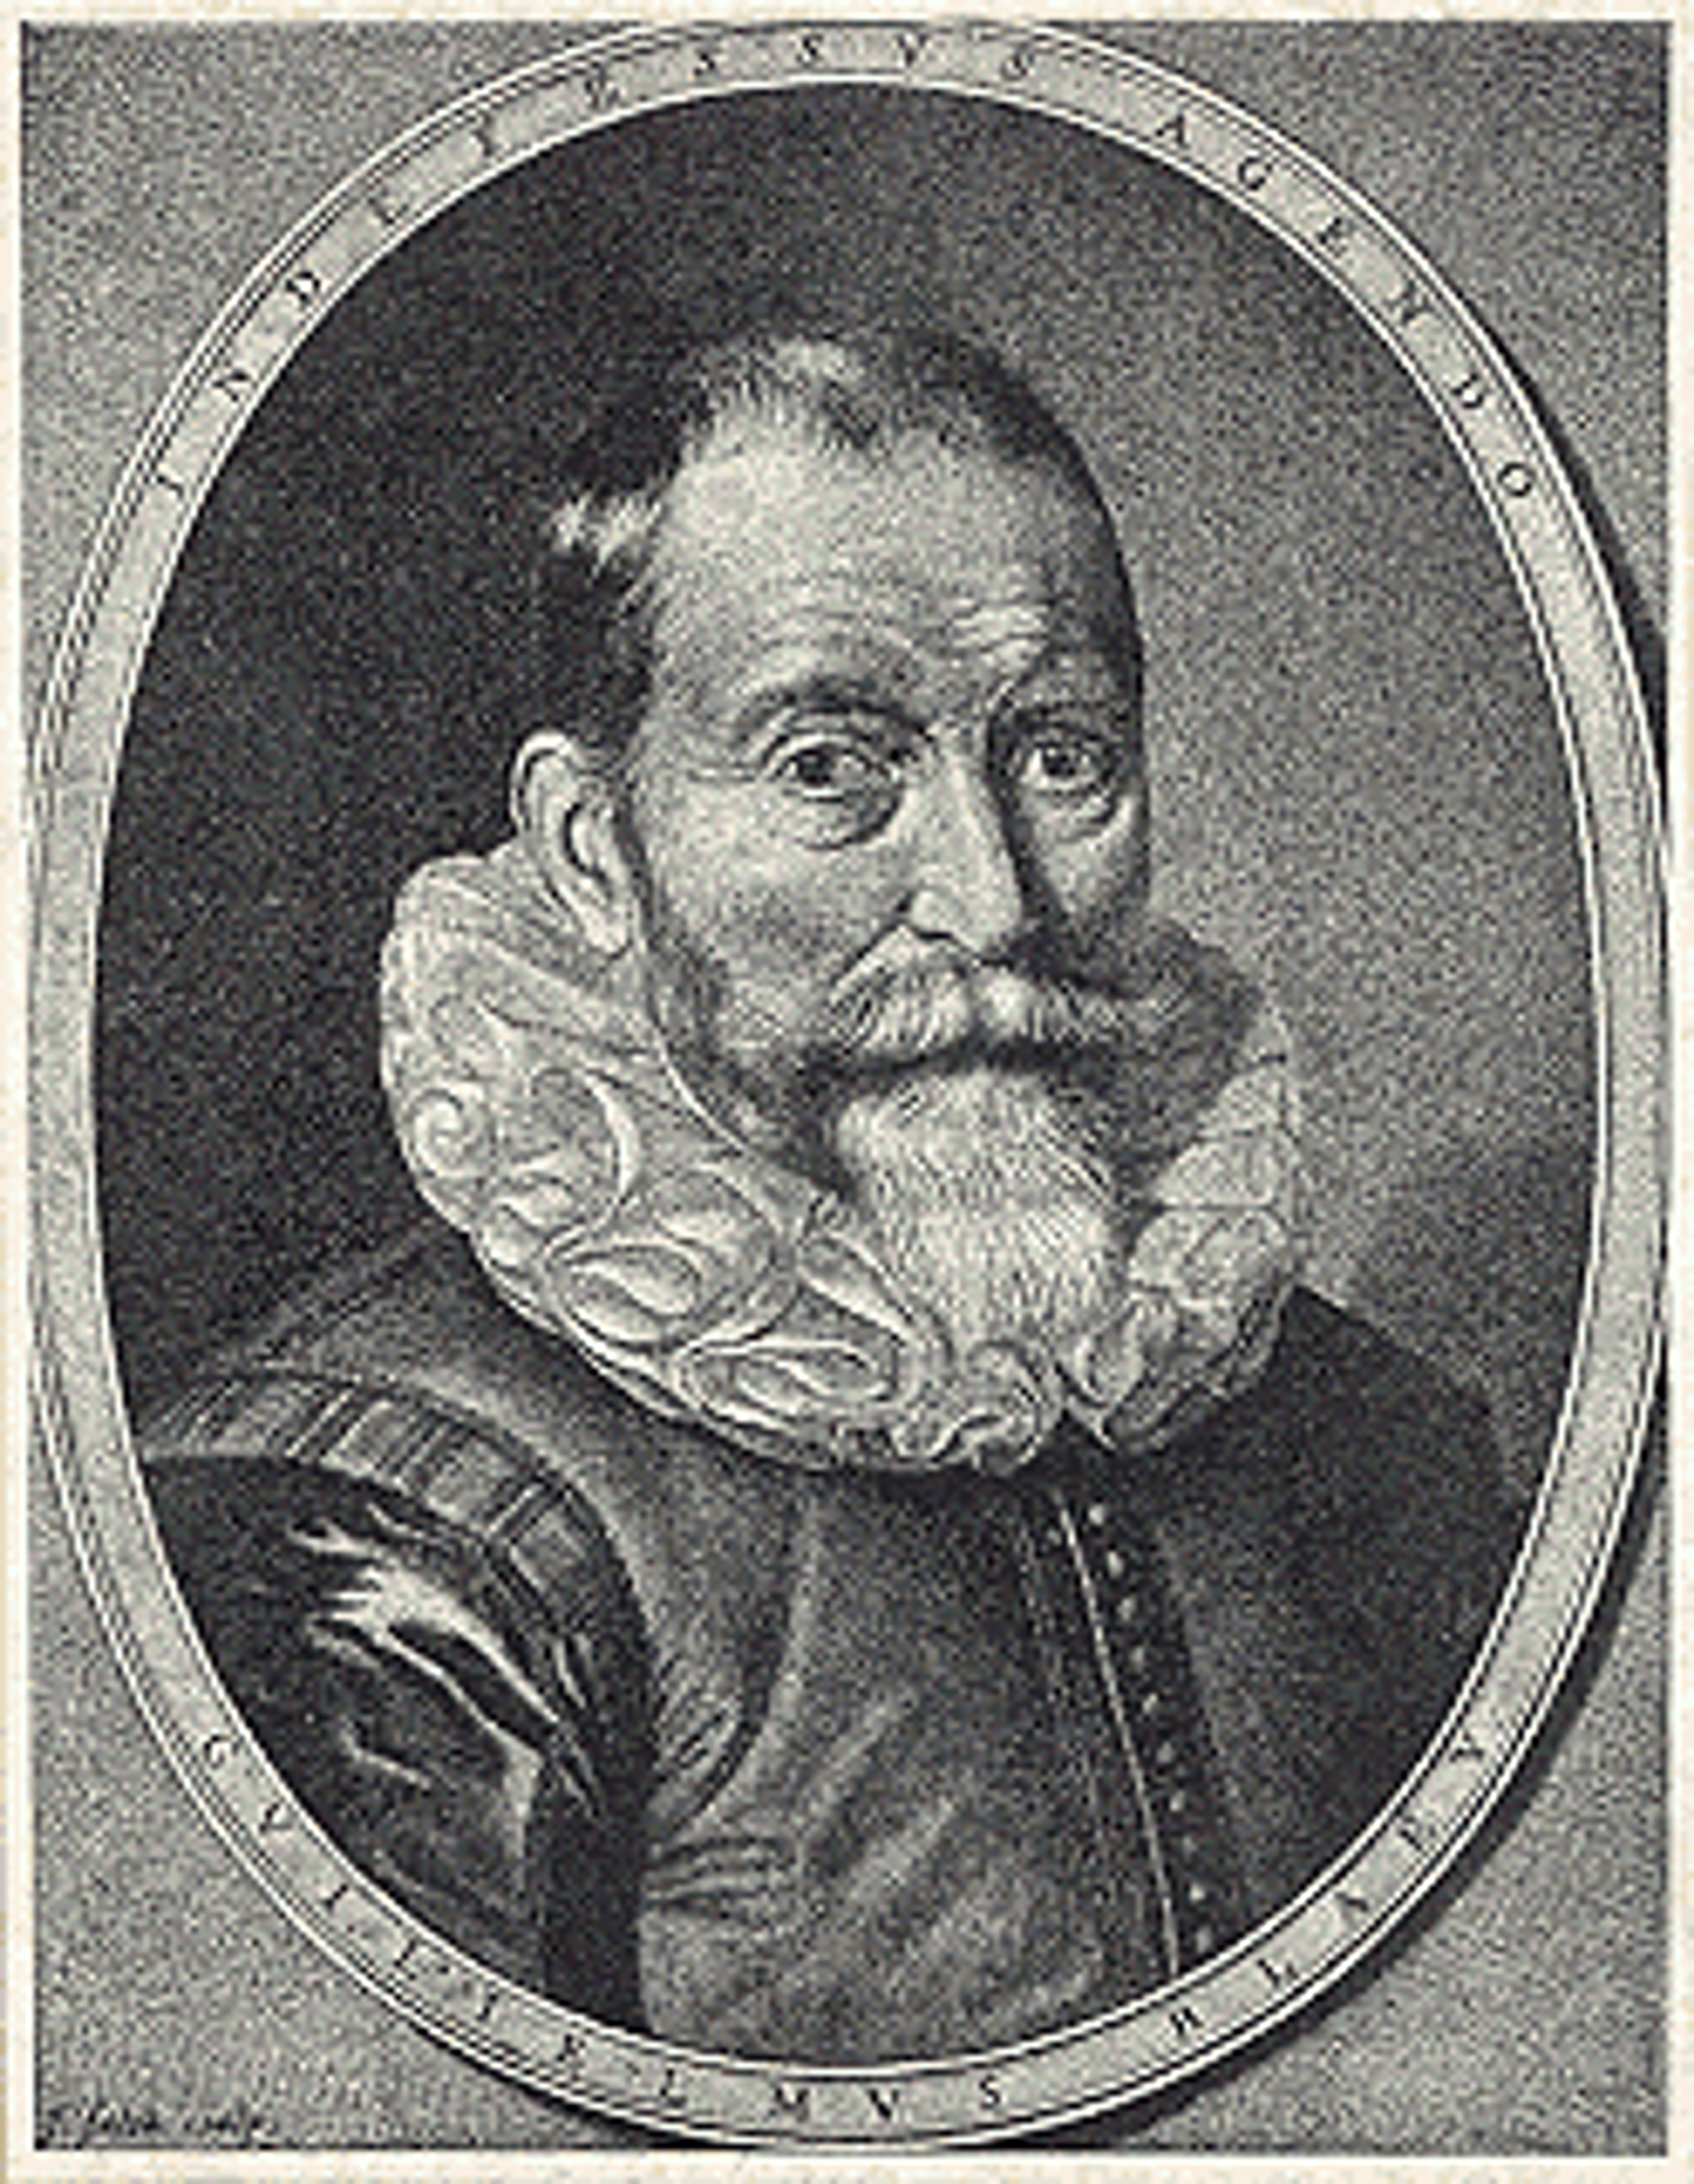
For example, the diagram illustrates the widespread influence of Nicolas Copernicus’ heliocentric theory across the works of Sebastian Münster, Abraham Goos, and Vincenzo Coronelli. It also highlights the mentorship of Claes Janszoon Visscher II under Jodocus Hondius I, and Frederik de Wit under Willem Janszoon Blaeu.

Reissued Work, Collaboration and Rivalry
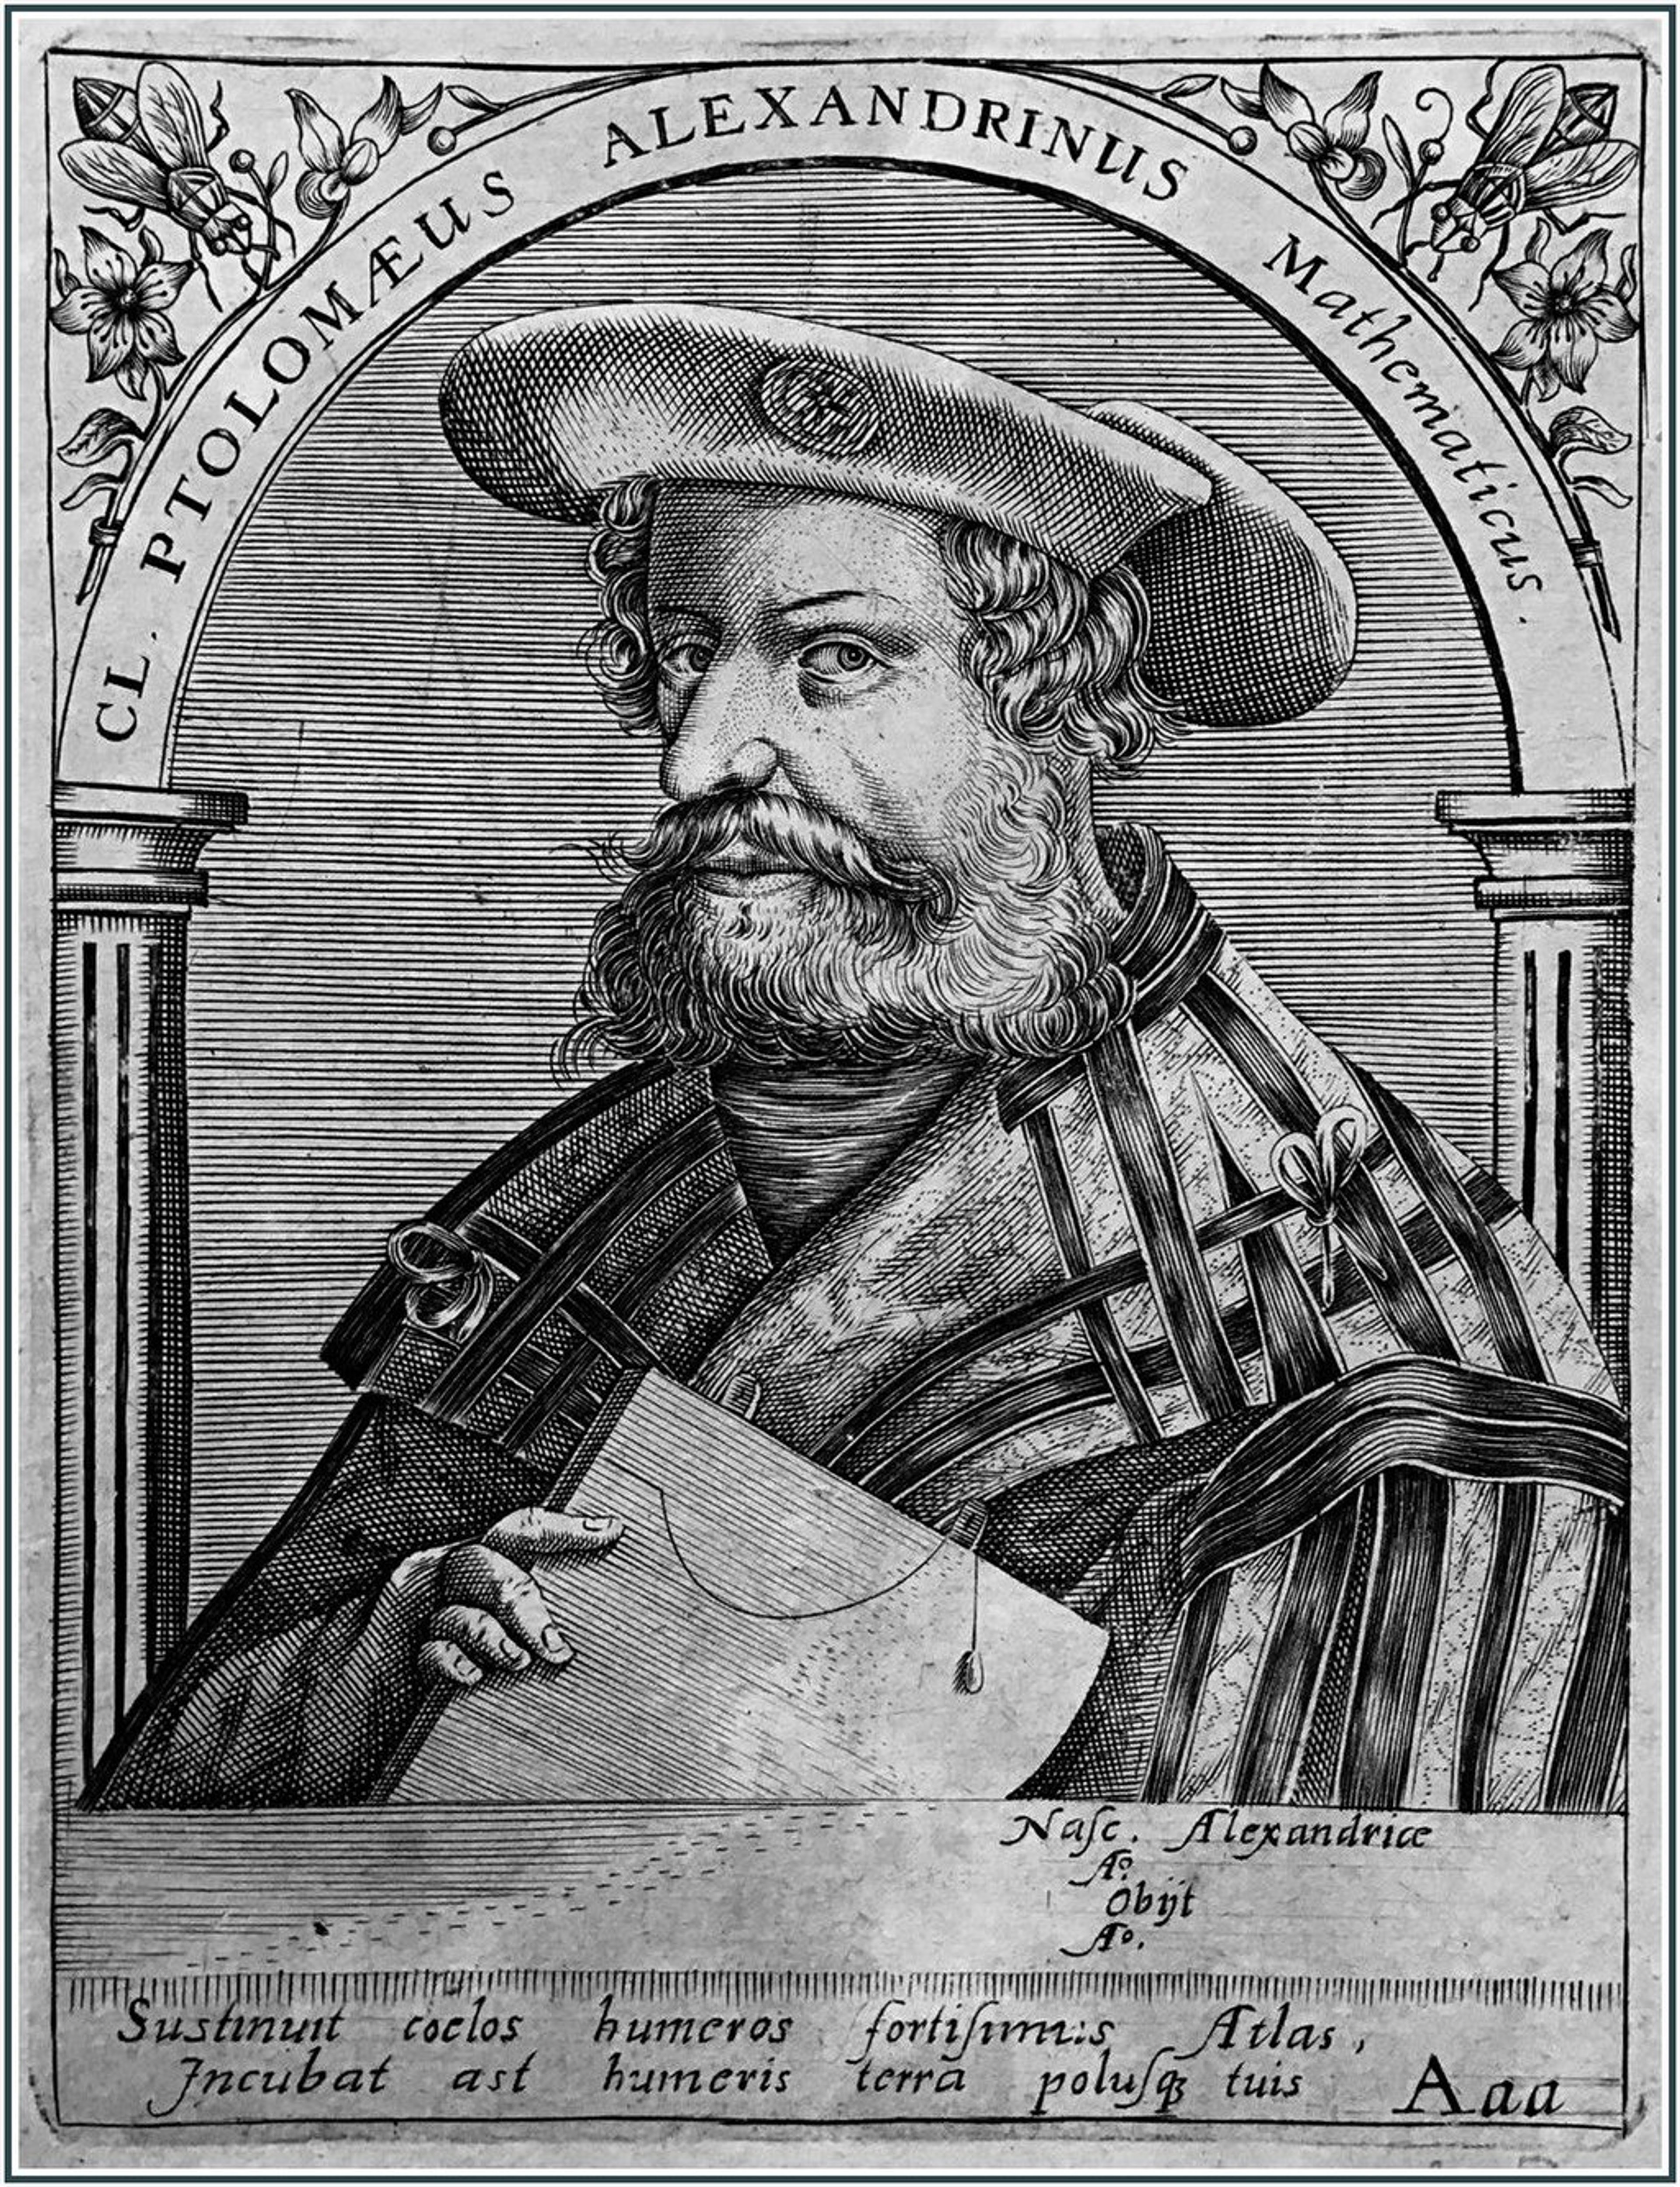
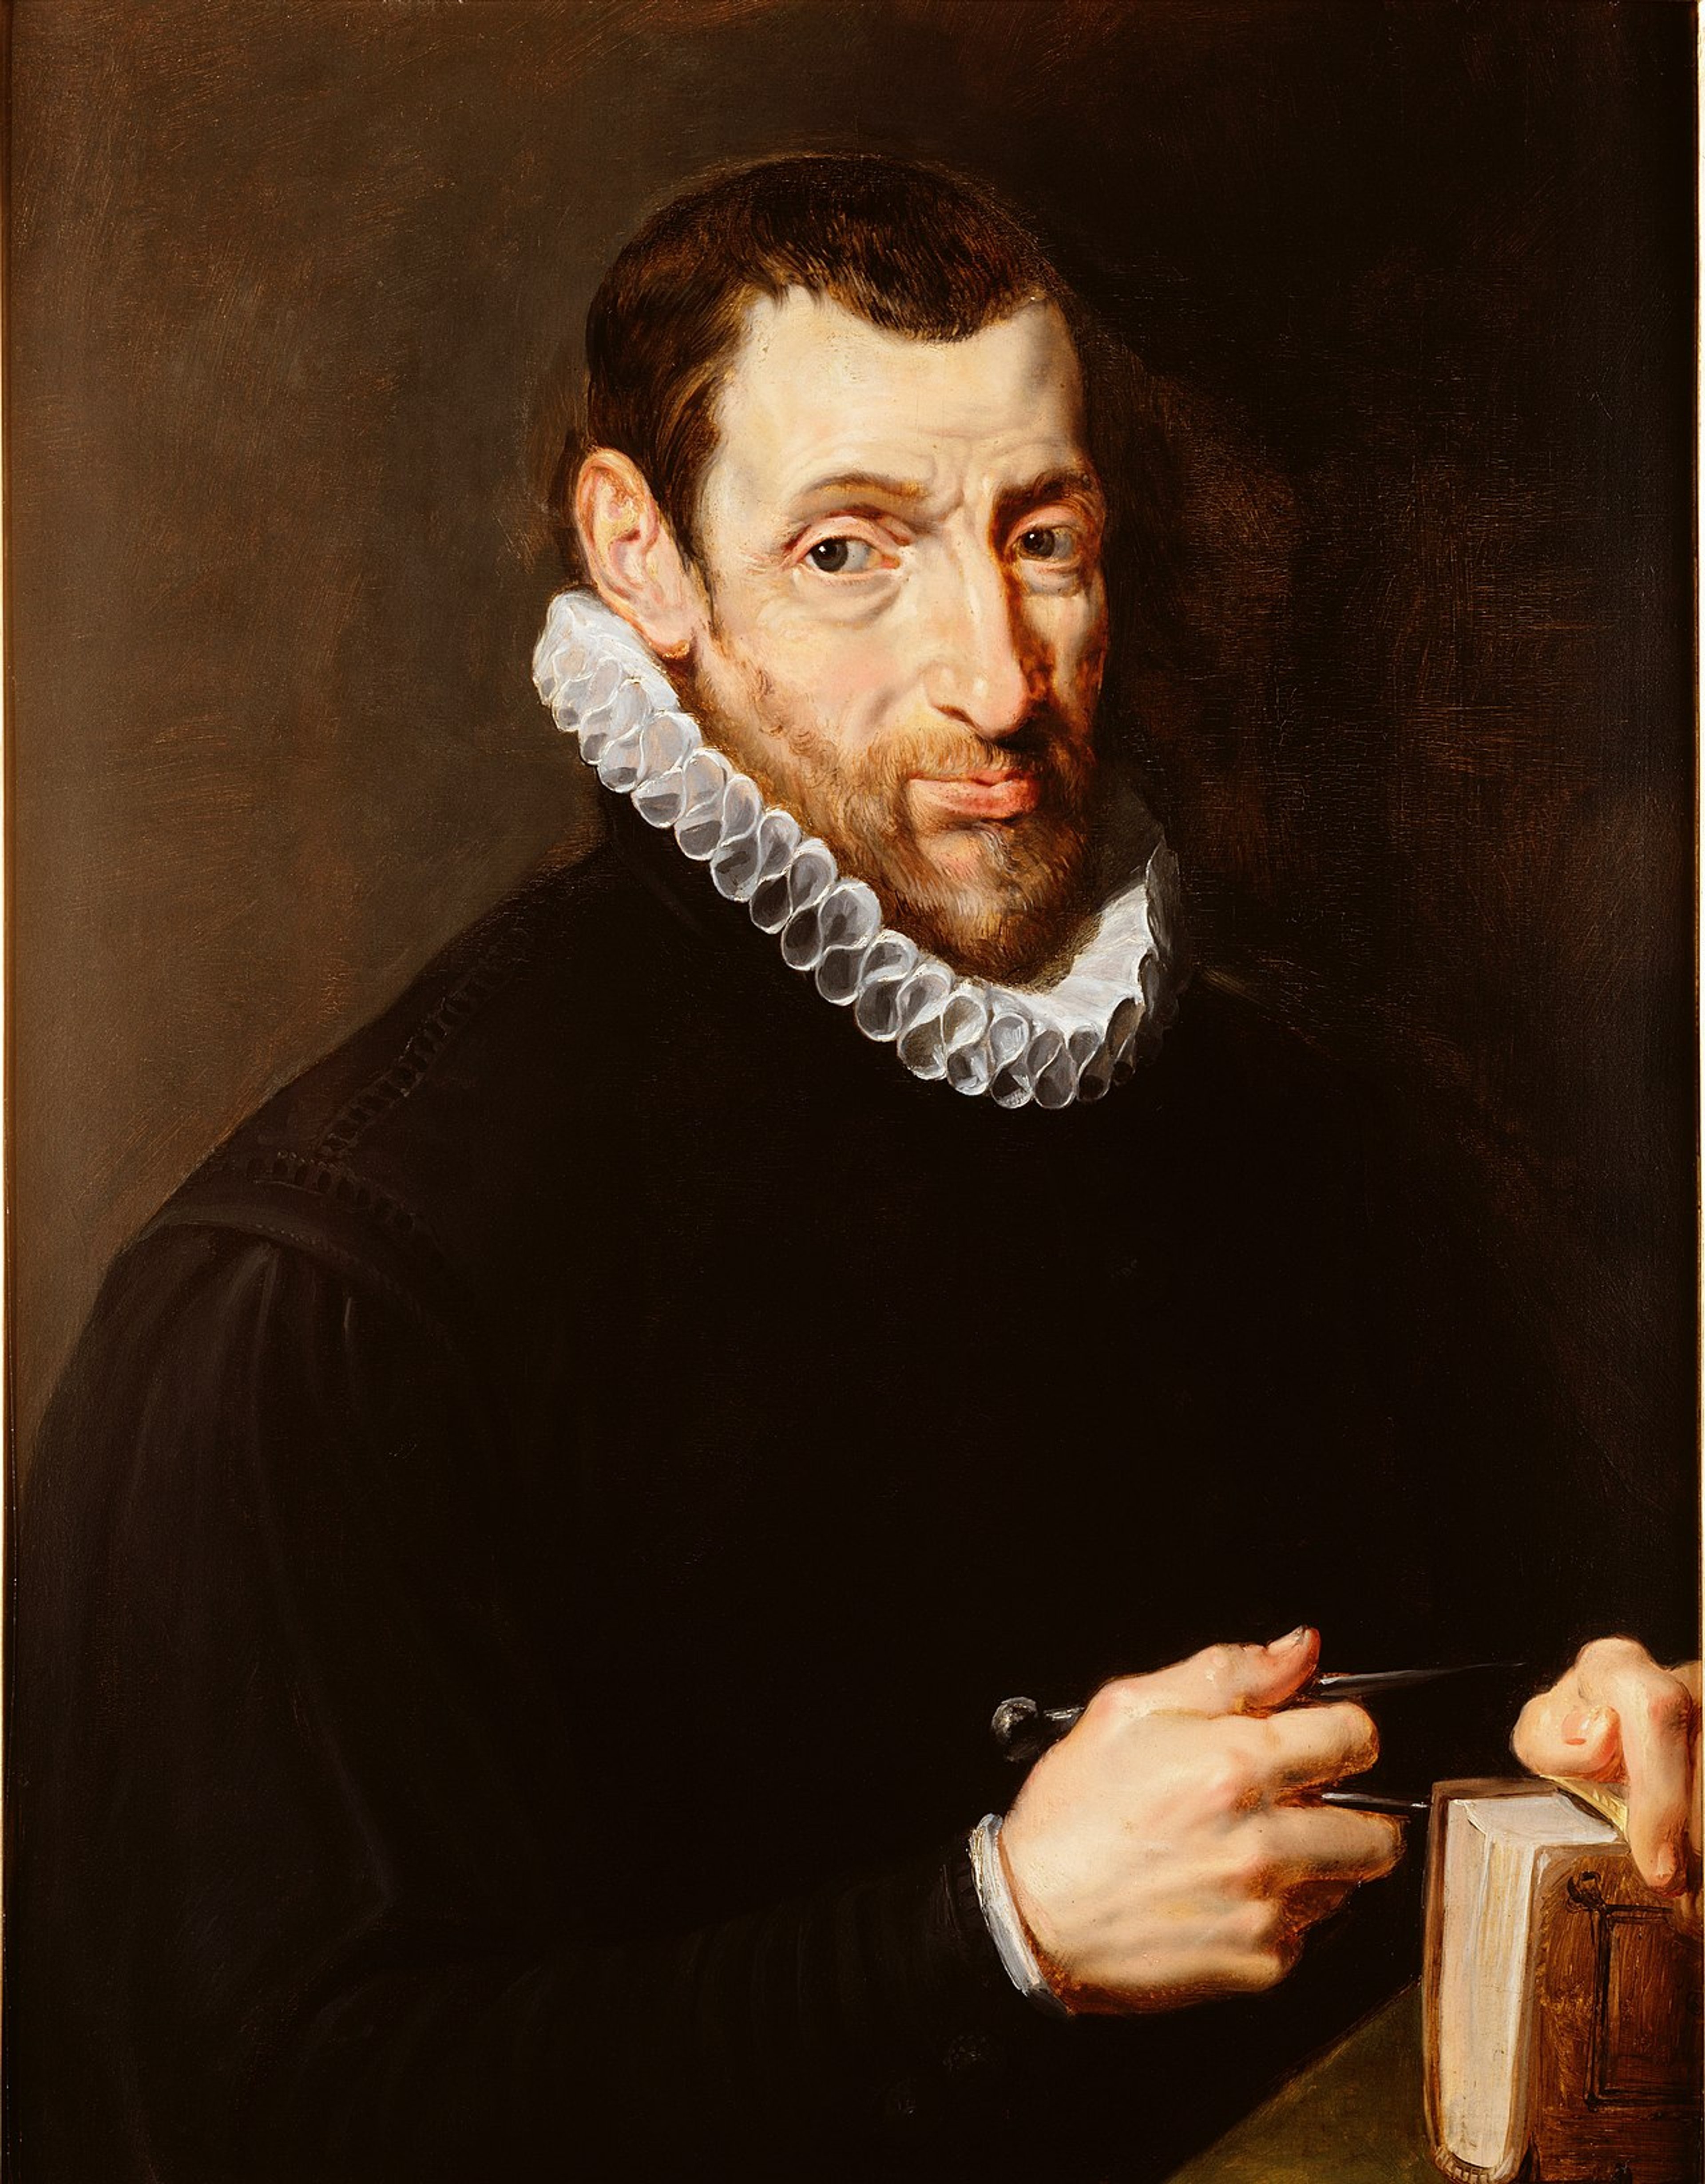
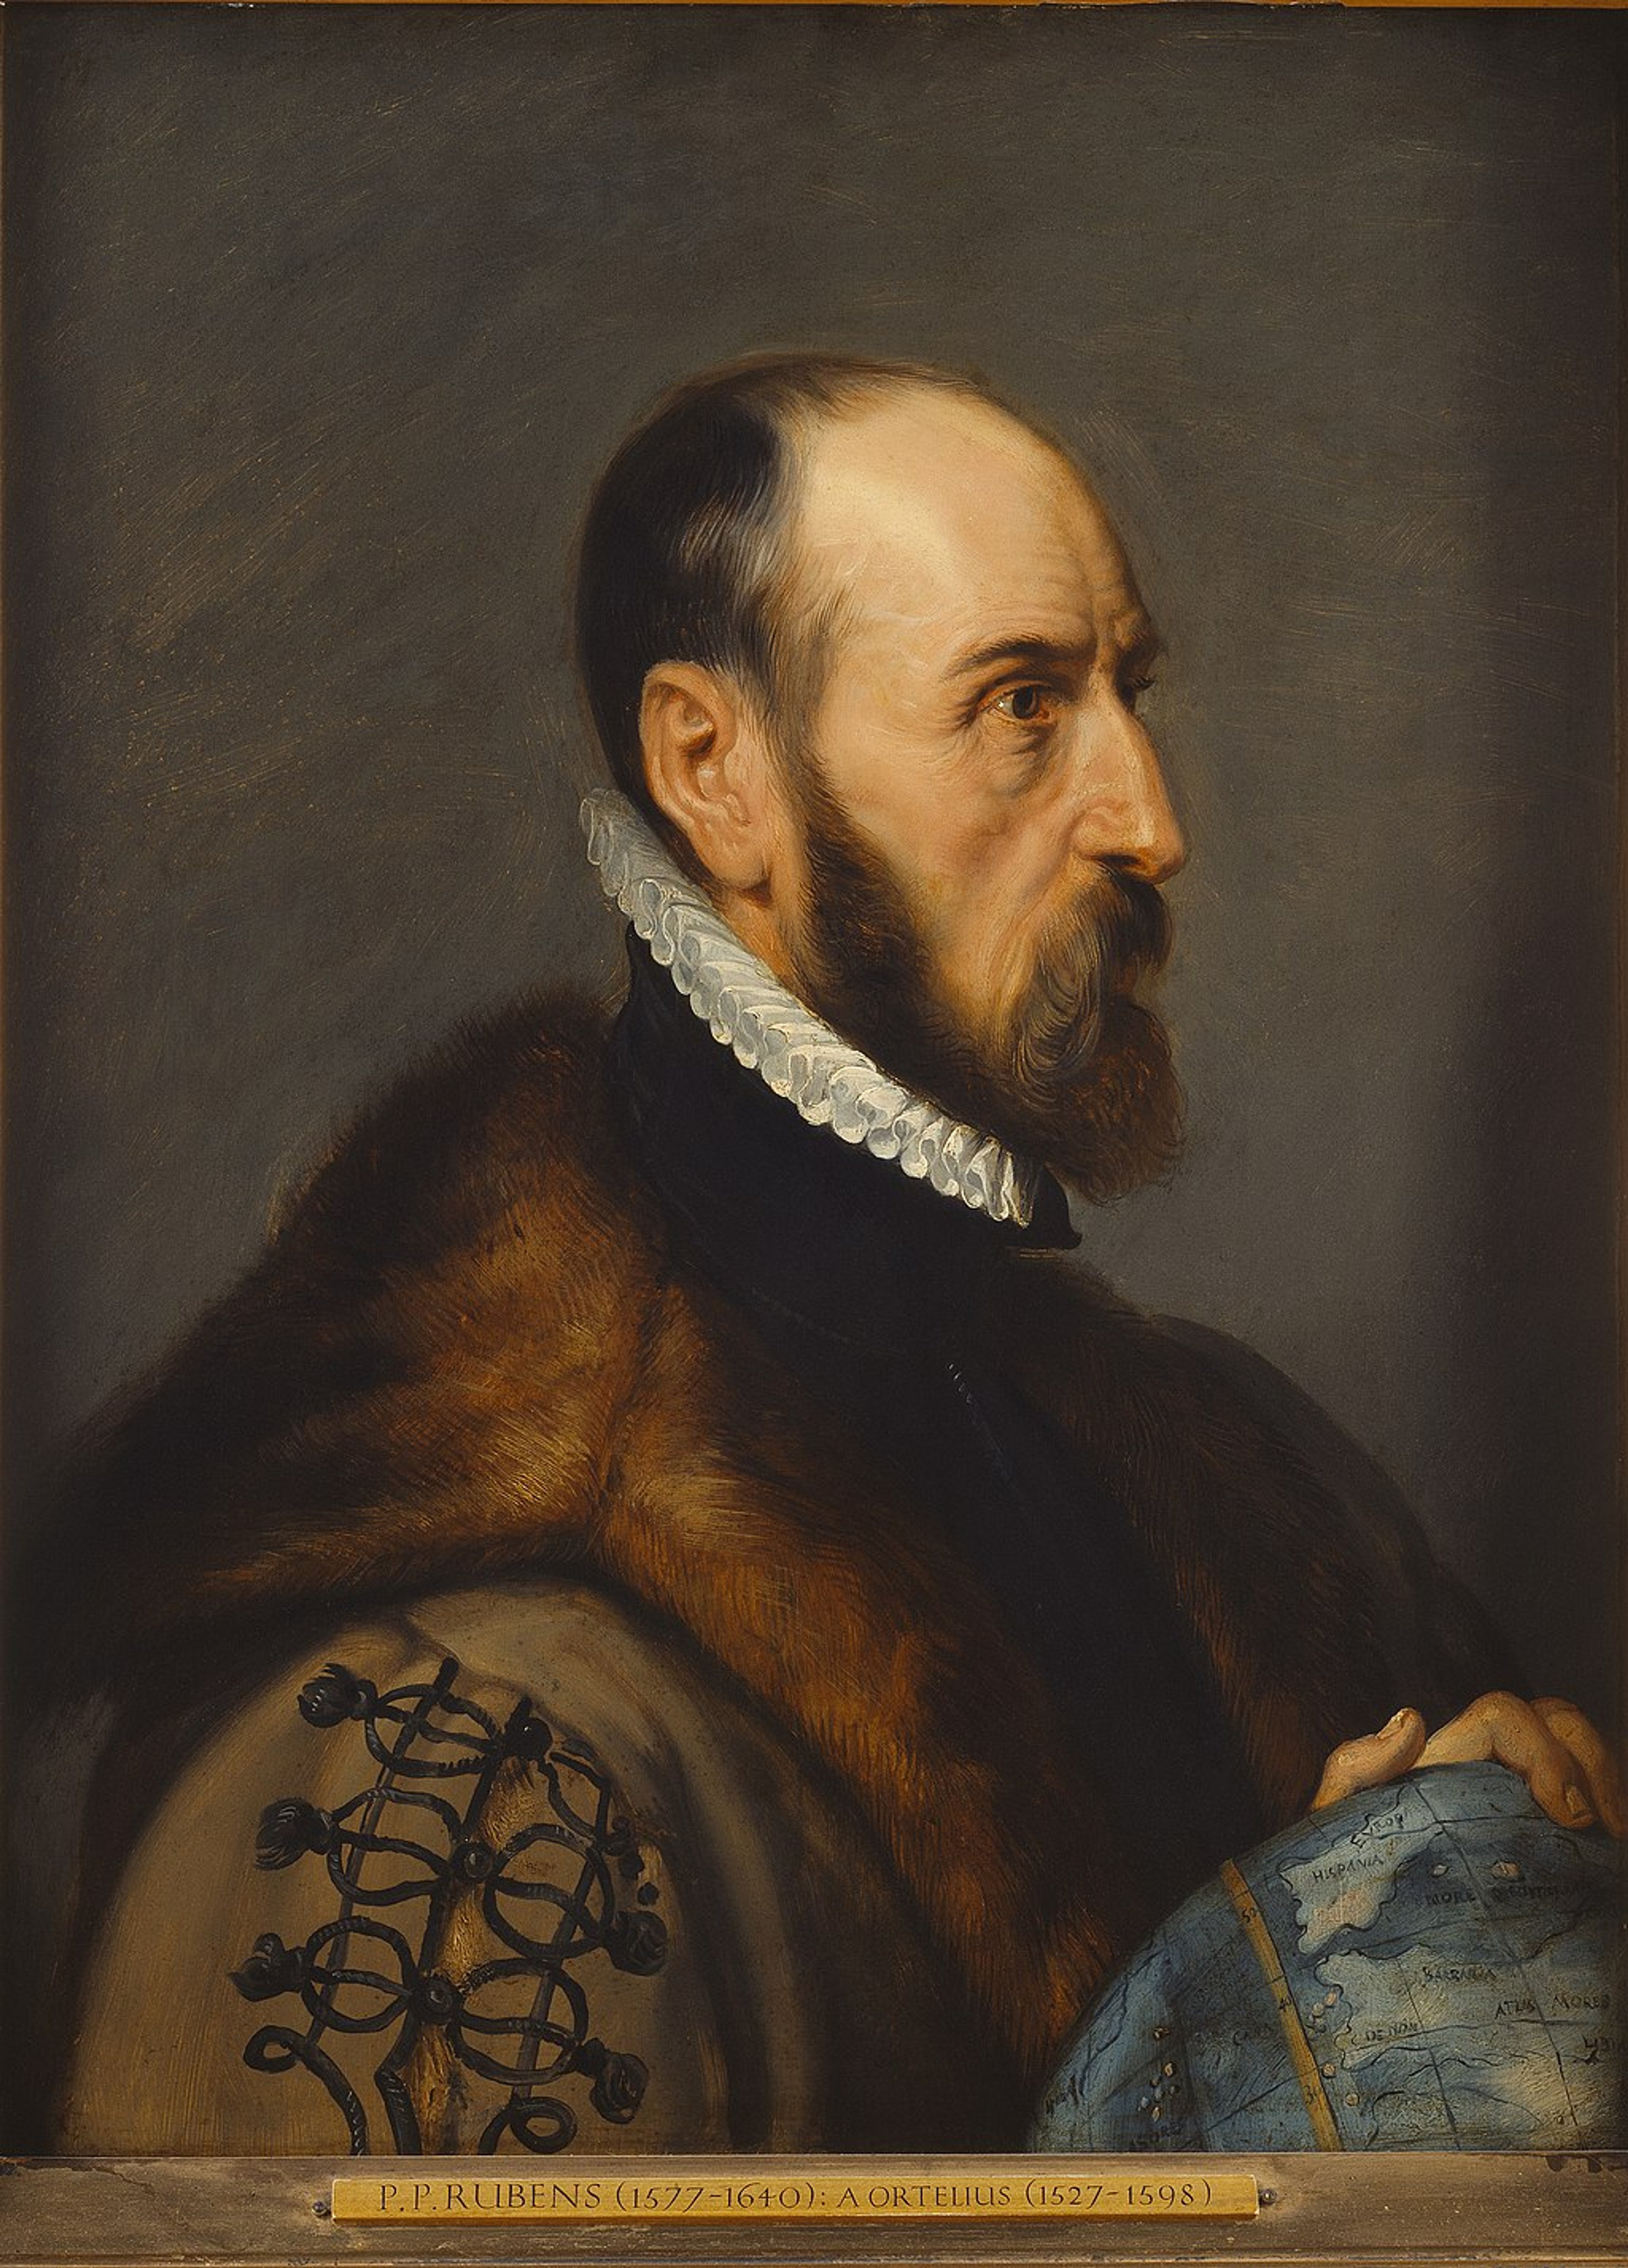
This matrix illustrates how ideas were reworked and refined through the reissuing of maps, as well as collaboration, and rivalries. In particular, it visualizes the role of key publishers such as Christophe Plantin, who contributed to the production of Abraham Ortelius’ ‘Theatrum Orbis Terrarum’ and Lucas Janszoon Waghenaer’s sea charts. It also highlights the enduring influence of Claudius Ptolemy’s classical ideas and the many editions of his ‘Geographia’ that were produced from the 15th to the 17th century.
Inherited wealth, Purchased plates, and Patronage
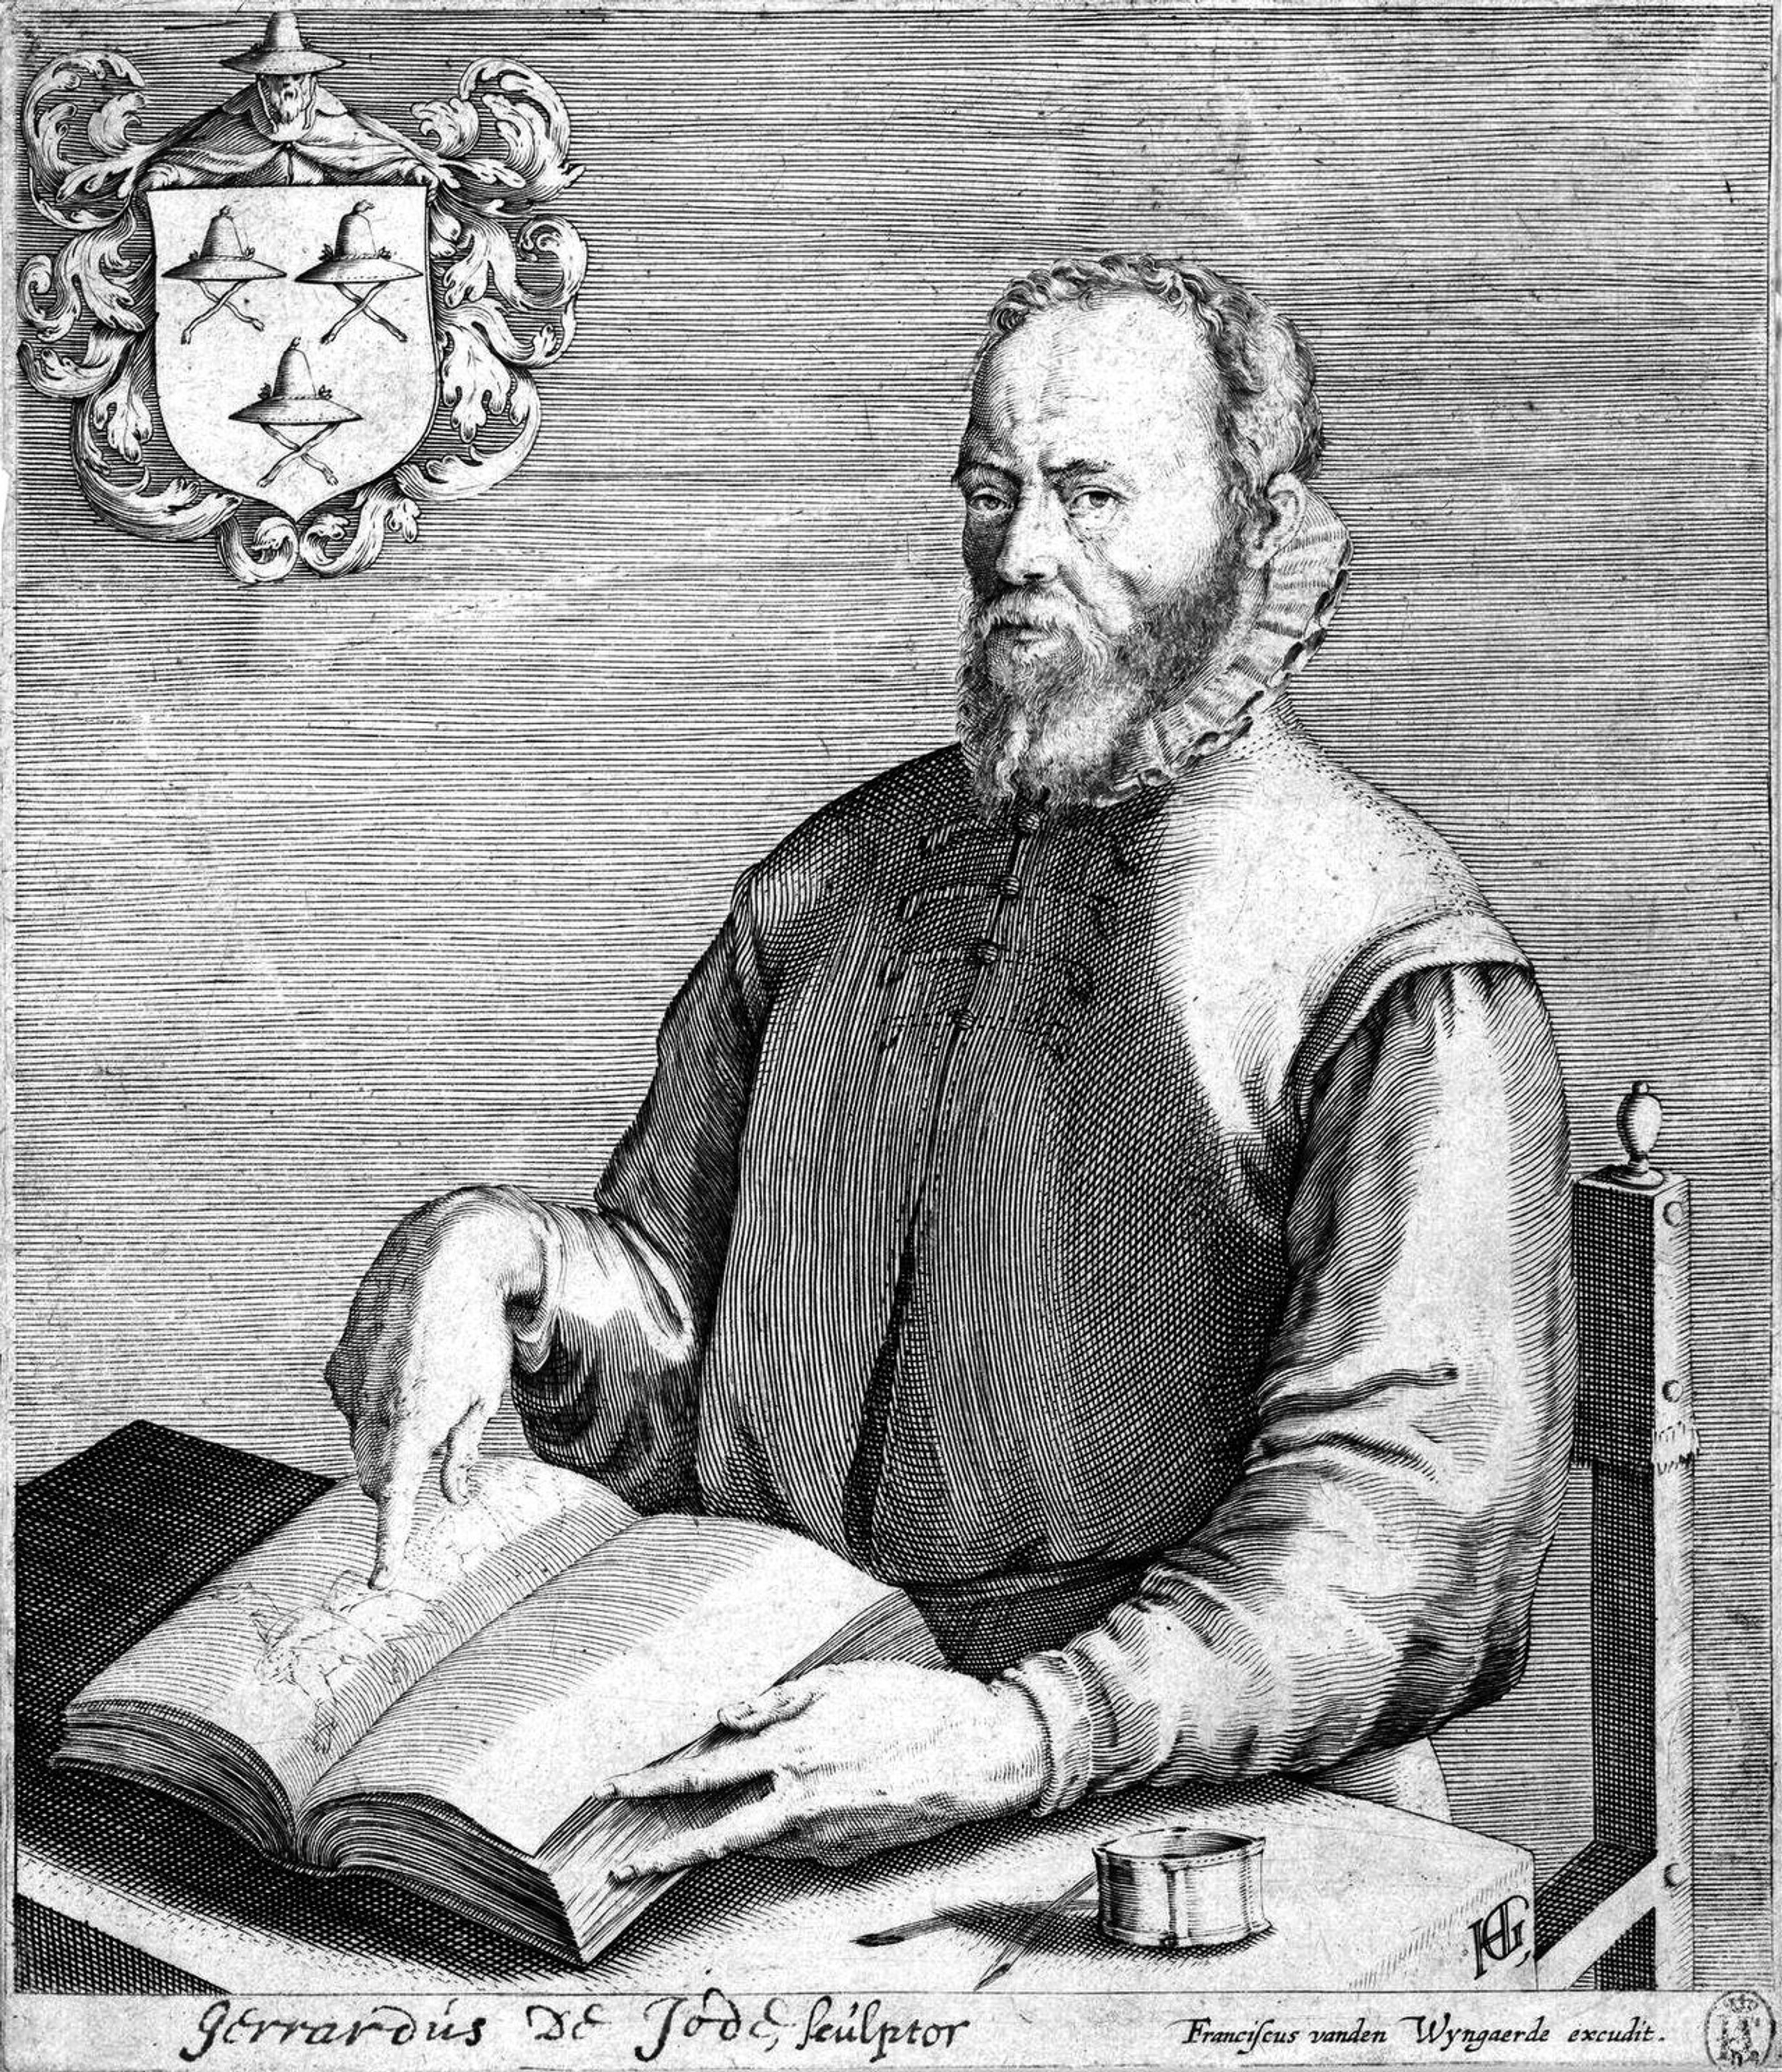
This matrix charts how printing plates and maps were obtained by collectors, inheritors, and the patrons of figures such as the Holy Roman Emperor Charles I and the Medici family. For example, it shows how Joan Baptista Vrints gained a monopoly over the cartographic market by acquiring the plates of prominent mapmakers such as Gerard de Jode and Abraham Ortelius. It also highlights the familial connections that ensured the enduring legacies of dynasties like the Blaeu and Hondius families.

Now you understand how they are connected, find out a little more about the individuals responsible for the maps, atlases and books of knowledge, featured in The Sunderland Collection by visiting our Mapmaker Profiles and Historical Timeline of Events.
The research and mapping of these three intricate matrices has been carried out by Melissa Irving and AJ Marshall.

Henricus Hondius' Nova Totius Orbis Geographica ac Hydrographica Tabula (1630)
Accessibility
Mapmaker Matrices shows the connections between items and cartographers in the Collection. On this page there are three matrices, each accompanied by a description of what they show and a selection of the people that are involved. Accompanying each matrix is a carousel of images featuring a selection of the people featured.
To view each of these three diagrams, all you need do is open each matrix using the black expand icon in the lower right of the image. This will expand into a full screen image with a zoom function. Across the image are portraits of prominent figures from the intellectual world throughout history, and arranged in chronological order. Time periods are indicated using horizontal banding.
Between the portraits of the mapmakers, there are white lines which have small circular, clickable icons on them. When clicked on, these open out to text panels in the right of the page, each to describe the nature of the connection. You can exit these using the small 'x' in the upper right corner of each panel. These are screen-reader compatible.
If you would like to view these interactive images with fewer gestures, once open, use the tab button on your keyboard to be guided through the points on the matrix. This will zoom in on the connections between the people, and by using the entre key you can open the text panels on this whistle-stop tour of cartographic history. This way you can navigate around the matrices with ease.
We will work to improve the accessibility of these features, but in the meantime, please Contact Us if you have questions or issues viewing this page.